GageView Pro & GageView Interface Programs
GageView Pro & GageView
Interface Programs

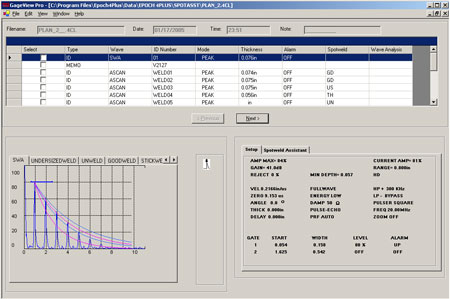
Panametrics-NDT� has recently released the Windows-based GageView�Pro
and GageView Interface programs that collect, create, print, and manage
data. GageView Pro, designed to help users optimize both
flaw detector
and thickness gage information, manages data from Panametrics-NDT
EPOCH 4,
EPOCH 4B,
EPOCH 4PLUS,
and
EPOCH LT
flaw detectors and
MG2-DL
thickness gage. GageView manages data from
MG2-DL
thickness gage.
The GageView and the GageView Pro Interface programs are especially
suited to the following tasks:
|
|
GageView Pro |
GageView |
|
Management of Instrument Calibration |
● |
● |
|
Storage of Inspection Data |
● |
● |
|
Thickness Surveys |
● |
● |
|
Report Generation |
● |
● |
|
Structural Weld Inspection (AWS) |
● |
|
|
Spotweld Inspection |
● |
|
|
DGS
/ AVG Inspection |
● |
|
|
Encoded B-Scans |
● |
|
GageView and GageView Pro include the following capabilities:
-
Creating Datasets and Surveys
-
Editing stored data
-
Viewing Dataset and Survey file
information including thickness readings, gage setup values, and
transducer setup values
-
Downloading and uploading Thickness
Surveys
-
Exporting Surveys to spreadsheets and
other programs
-
Collecting snapshot screens
The GageView and GageView Pro Interface programs require computer system
features such as: Industry Standard Architecture (ISA), a SVGA or higher
resolution monitor, a 486 or higher microprocessor, and a USB port.
Information management capabilities are fully screen accessible. For
example, the Create New Database screen, shown below, allows the user to
name a new database, browse for an existing database, and choose an
appropriate database or devise type through an easy-to-use menu.

For most activities, operation continues through step-by-step procedures
that are both resource efficient and straightforward. The ID Generation
screen below provides the user with clear information requirements.

The creation and the management of reports are equally easy and screen-driven,
as shown in the Reports screen below:
