Previous Page | UTIA Main Page | Next Page
C-Scan View Functions
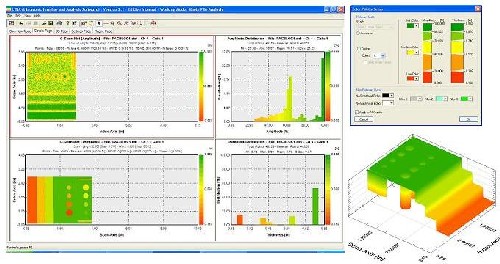
Obtain color coded C-Scan images of thickness or amplitude for any gate and channel. View 3D C-Scan images with full rotation and zooming capabilities. Adjust C-Scan orientation and scan direction to get actual scan presentation. Mouse trace for exact values at each point on the scan. Use automatic or custom (user defined) color palette. Set colors according to design values. Perform analysis on multiple pages for detailed view of the data. Setup each graph differently to compare gate and channel results.
Obtain color coded C-Scan images of thickness or amplitude for any gate and channel.
View 3D C-Scan images with full rotation and zooming capabilities.
Adjust C-Scan orientation and scan direction to get actual scan presentation.
Mouse trace for exact values at each point on the scan.
Use automatic or custom (user defined) color palette. Set colors according to design values.
Perform analysis on multiple pages for detailed view of the data.
Setup each graph differently to compare gate and channel results.
Download Information About UTIA in PDF Format