|
    
Previous
Page |
Noesis Main Page
| Next
Page
Noesis
Data Statistics
Noesis provides
the user, and especially the acoustic emission data analyst, with a new way of
looking at the data: Statistics. Typical AE practices relay on 'statistics' to
discriminate noise, genuine AE and other types of emission. These 'statistics'
relied on the capability of the analyst to view graphs and decide how data
relate to each other and to known limits and general rules. Noesis provides a
full statistical review of the data so that some observations are made easier
by looking at straightforward numbers. Especially in the case of
data clustering the user has powerful statistics to compare groups with
each other and make decisions as to the effectiveness and/or correctness of the
classification algorithm or
manual data
separation into groups (clusters). Statistics can provide information
about the separability of data, the correlation between features, clustering
efficiency etc.
-
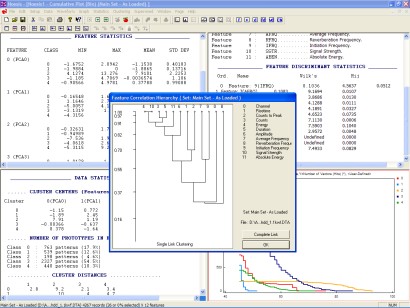
Channel Statistics
including Min, Max, Average etc.
-
Amplitude Distribution tables (per
channel and class).
-
Min, Max, Mean, Skewness,
Curtosis etc. for all data sets.
-
Feature correlation matrices
and dendrograms for tabular and graphical correlation views.
-
Various criteria for
vector or feature statistics (Wilk's, Rij etc.). These criteria can be used for
evaluating clustering effectiveness.
-
Feature and Class discriminant
Statistics.
-
Class Statistics for
unsupervised, manual, and supervised acoustic emission data classification
(cluster centers, cluster distances etc.) for an overview of data clustering.
Download Information About Noesis in PDF
Format
|